Network Visualization Based on Four Thresholds
This visualization compares network structures based on four different thresholds. Below each network depicts the number of nodes with degree > 0 (NN Deg >0), the number of edges (N Edges), and the maximum degree value in the network (Max-Deg).
Final Microbiome Network
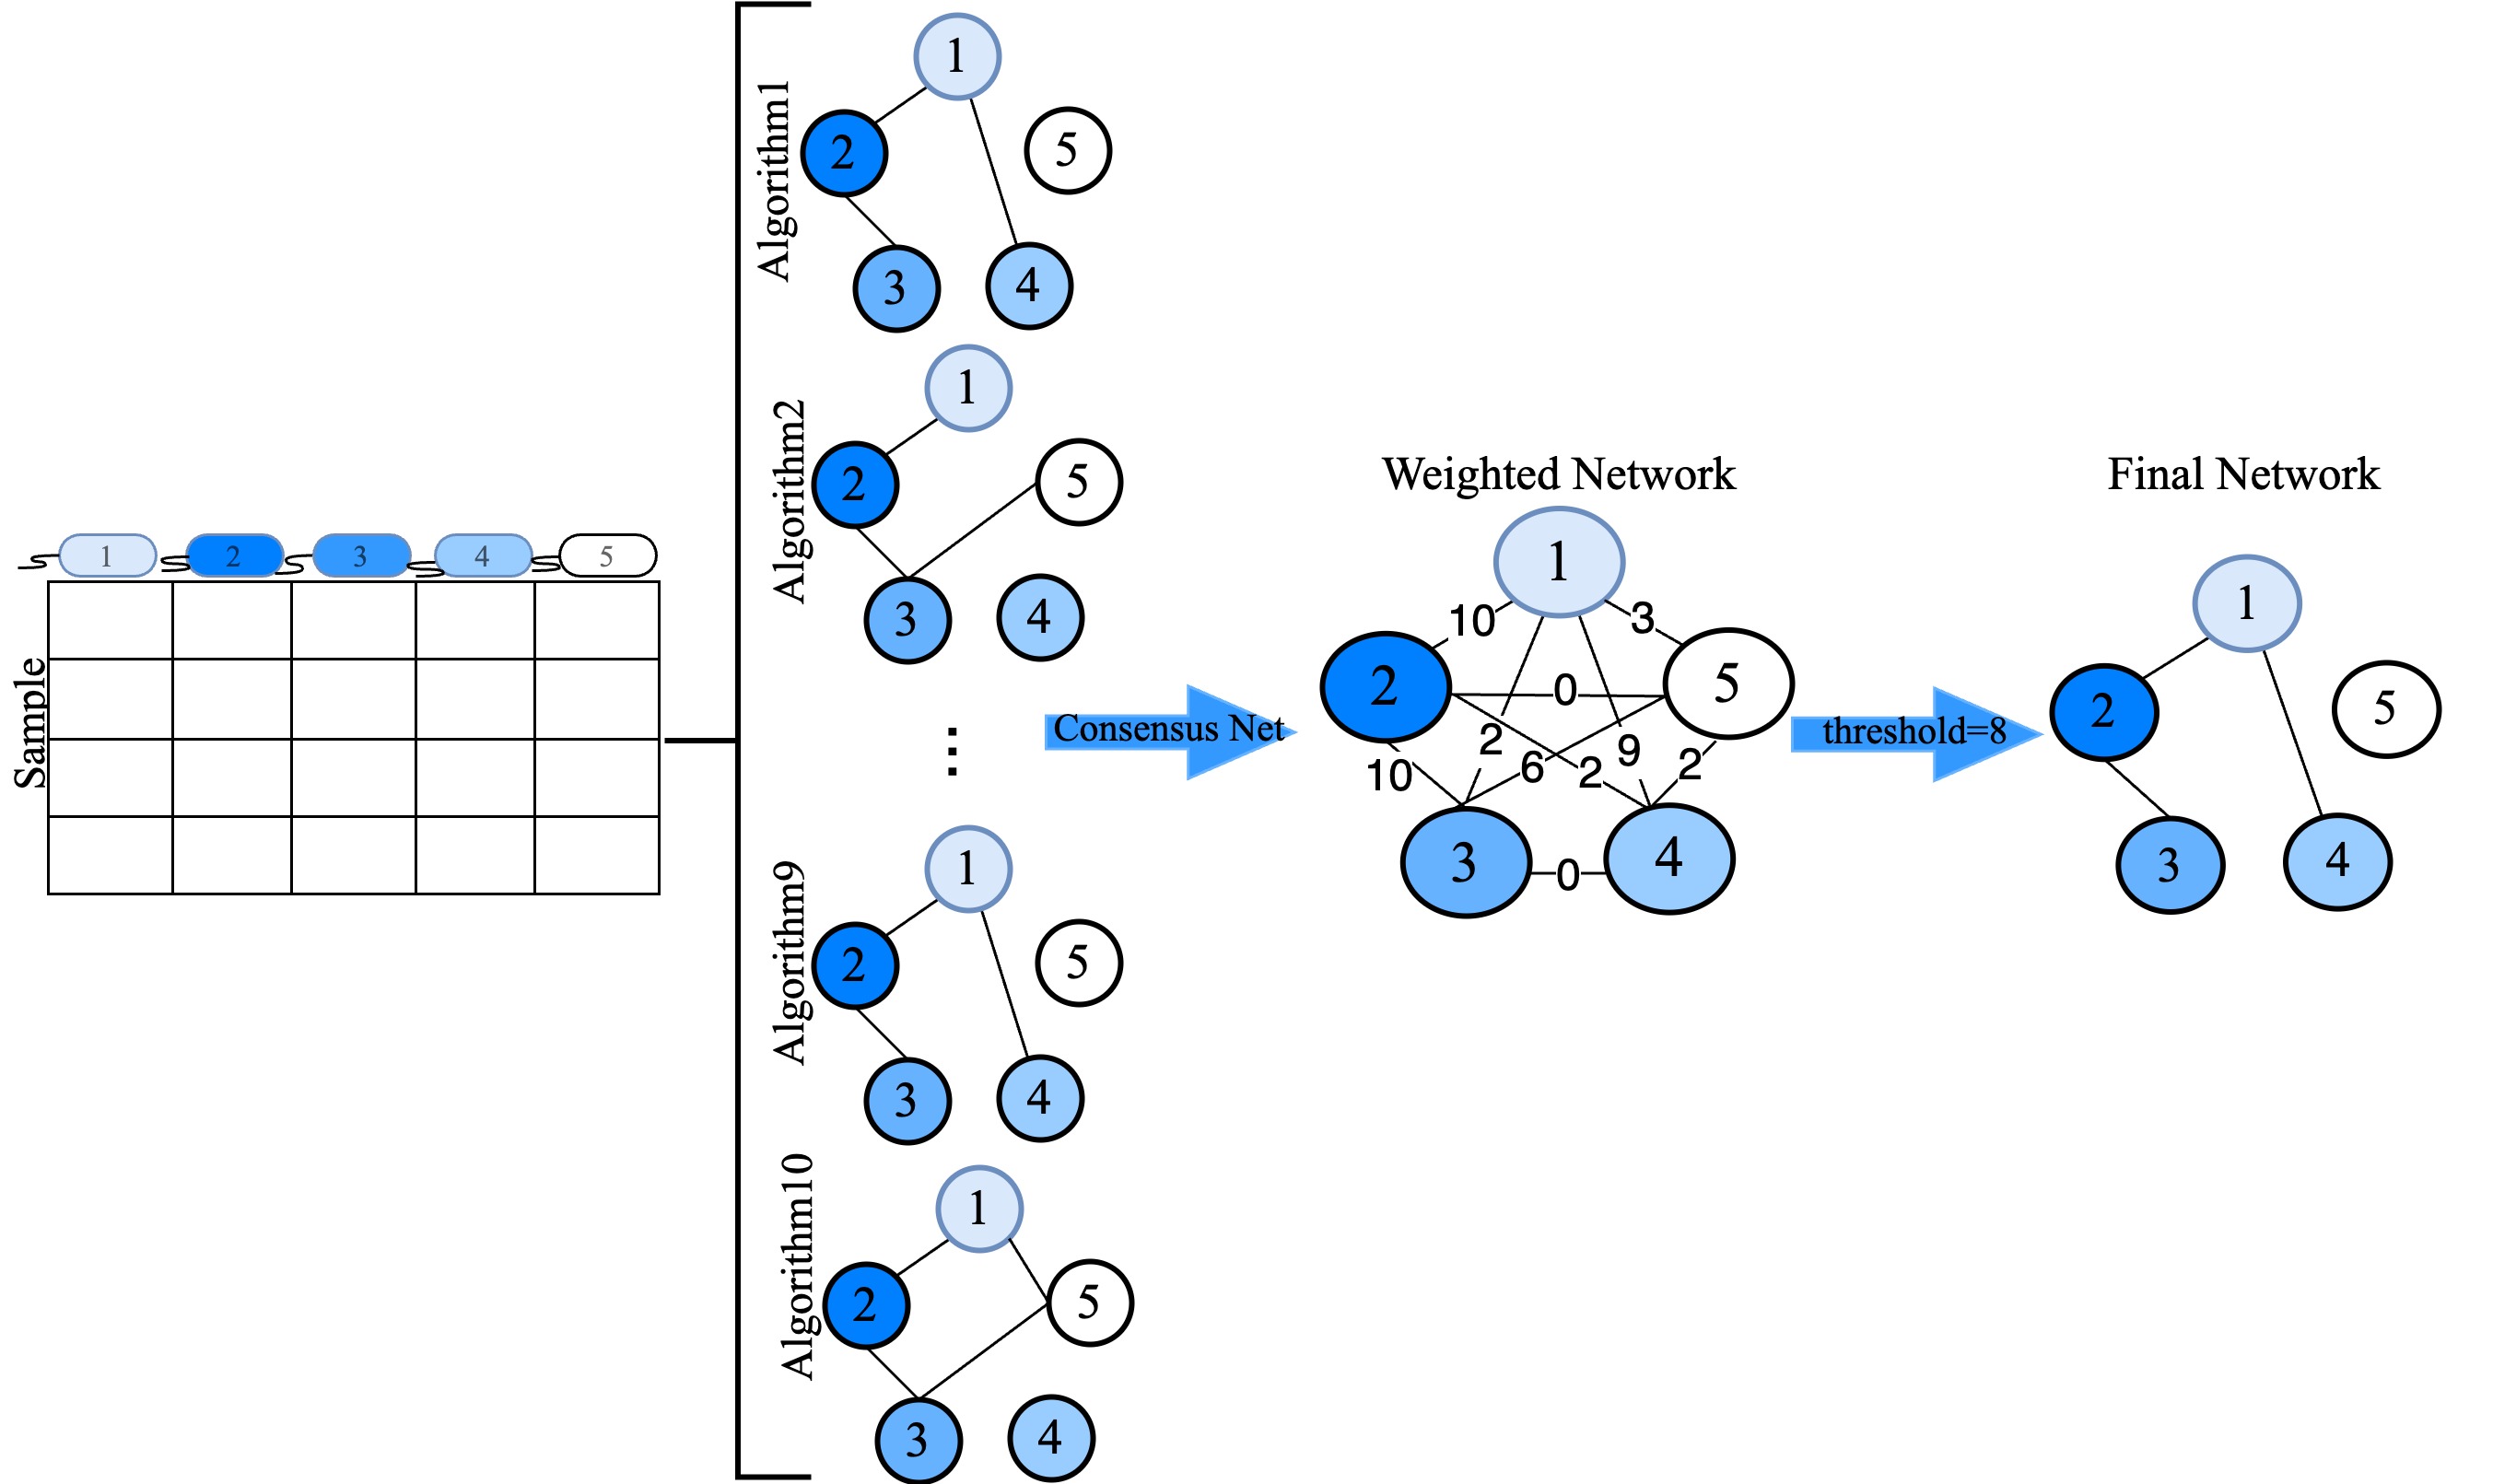
CMiNet: : Consensus Microbiome Network is an R package designed to generate consensus microbiome networks by integrating results from multiple network construction algorithms. This tool is specifically tailored for microbiome data, where capturing the intricate relationships between microbial taxa is essential to understanding complex biological systems and their impacts on health and disease.
The package employs a range of established algorithms, including Pearson and Spearman correlation, Biweight midcorrelation, Sparse Correlations for Compositional data (SparCC), Sparse InversE Covariance estimation for Ecological Association and Statistical Inference (SpiecEasi), Semi-Parametric Rank-based Correlation and Partial Correlation Estimation (SPRING), Generalized Co-Occurrence Differential Abundance analysis (gCoda), Correlation Inference for Compositional Data through Lasso (CCLasso), and a novel algorithm based on conditional mutual information (CMIMN). These algorithms construct individual microbial association networks, which CMiNet then combines into a single, weighted consensus network. By leveraging the strengths of each method, CMiNet provides a comprehensive and reliable representation of microbial interactions.
Algorithms Applied in CMiNet:
- Pearson coefficient (cor() from stats package)
- Spearman coefficient (cor() from stats package)
- Biweight Midcorrelation (bicor() from WGCNA package)
- SparCC (R code on GitHub)
- CCLasso (R code on GitHub)
- SpiecEasi (SpiecEasi package)
- SPRING (SPRING package)
- CMIMN (CMIMN package)
- gCoda (R code on GitHub)
Running CMiNet Shiny App
We put the American Gut data from SpiecEasi package as an example to run. You can print the original and ID taxa names in the CMiNet page, tab data summary.
The CMiNet Shiny App contains four main pages:
- CMiNet: This page allows users to construct a consensus network from microbiome data using multiple methods. You can select the algorithms you want to use and download the results of each algorithm separately, along with the weighted network.
- Visualization: This page processes a weighted microbiome network and visualizes it across different thresholds. Each threshold represents a minimum edge weight required for inclusion in the network plot.
- Final Network: This page illustrates the final network produced by CMiNet based on the threshold defined by the user.
- About: Contains detailed information about running and interpreting results from CMiNet.
- GitHub: CMiNet Algorihtm
Citation
If you use CMiNet in your work, we kindly ask that you cite the following papers:
[1] Aghdam R, Solis-Lemus C. CMiNet: R package for learning the Consensus Microbiome Network. arXiv preprint arXiv:2411.08309. 2024.
[2] Aghdam, R., Tang, X., Shan, S., Lankau, R., & Solís-Lemus, C. (2024). Human limits in machine learning: prediction of potato yield and disease using soil microbiome data. BMC bioinformatics, 25, 366.